Source: Continued economic growth? (GMT 5) — EEA
Economic output is projected to treble between 2010 and 2050, although growth is expected to decelerate in many countries as they become more prosperous. Rapid economic growth has brought reductions in global poverty and increases in well-being but it is also linked to growing inequality and escalating environmental pressures. In Europe, slowing growth is straining public finances for environmental protection and increasing social inequality.
The limitations of gross domestic product (GDP) as a measure of human well-being and the sustainability of growth have prompted international efforts to identify better indicators of societal progress.
Drivers
Globally, countries are continually seeking ways to stimulate economic growth as a means of providing jobs and improving living standards. At the most basic level, economic output depends on population size and output per person; each has accounted for about half the global economic growth since 1700 [1]
While population growth is linked to fertility, mortality and migration rates (GMT 1), productivity has more complex determinants. Today it is understood to depend on the development of four key forms of capital: human (knowledge, skills and health); social (trust, norms and institutions); manufactured (machinery and infrastructure); and natural (resources and ecosystems) [2]
Often these capitals are complements, with the value of one dependent on the presence of another. For example, if natural resource wealth is not accompanied by effective state institutions, it can fuel corruption and weaken competitiveness, thereby undermining economic growth [3]. Equally, investments that augment manufactured capital are likely to be counter-productive if they degrade essential environmental systems. As Daly has observed, ‘what good is a sawmill without a forest?’ [4]
Technological and social innovation plays a key role in the development of capital stocks, driving long-term growth. Examples include the development of tools and machinery, and aggregation of labour and businesses in urban settings, and the division of production processes into multiple stages handled by different workers. Such innovation increases productivity – enabling society to maximise the economic returns on finite inputs of labour and resources. Innovation is also at the core of structural economic change – the transition from largely agrarian economies through industrialisation to largely service-based structures.
As a result of innovation and investment, several of the capital stocks underpinning economic output have been increased markedly in recent decades. In developed countries, manufactured capital was worth 2.0–3.5 years of national income in 1970 but increased to 4.0–7.0 years of national income by 2010 [5]. Workforces also expanded. The global population of those aged between 15 and 64 tripled to 4.54 billion in the period 1950–2010 [6]. Education, skills and human health are also improving, particularly in developing regions (GMTs 1, 3). At the same time, however, natural capital is increasingly under pressure (GMTs 8, 9, 10).
Trends
The spread of global growth
Rapid economic growth is a comparatively recent phenomenon. Productivity increases were negligible before 1700, implying that economic output rose no faster than the very modest rate of population growth — about 0.1 % annually. In the 18th century, however, the agricultural and industrial revolutions in Western Europe caused a fundamental shift, initiating a steady acceleration of economic growth. By the first half of the 20th century, average annual global GDP growth had reached 2 % and this rose to 4 % in the period 1950–2008. As a result, world economic output increased 25-fold in the period 1900–2008 [1]
Global growth in recent decades was made possible by the exceptionally rapid economic expansion in some very large developing countries, which were able to import knowledge, practices and technologies rather than going through the slower process of developing them domestically. China is the most important example – its economy grew by an average of 9.8 % per year in the period 1980–2013, doubling in size every seven years [7]
The financial crisis of 2008 and subsequent economic turmoil had a major impact on economic growth globally. Developed regions were hit hardest. In 2013, for example, the EU’s economic output was still 1 % below its 2007 level [7]. Major developing countries including Brazil, Russia and South Africa also endured recessions, while others — notably China, India and Indonesia — faced an appreciable slow-down in growth.
Many emerging economies have since proven to be remarkably resilient, however, sustaining global growth despite stagnation is most advanced economies. In 2007–2013, India’s GDP increased by 46 % and China’s by 68 % [7]. As a result, the financial crisis greatly advanced the rebalancing of economic production across the world (GMT 6).
Decelerating growth
Following the 2008 financial crisis, many uncertainties surround the short-term outlook for global growth. These include, for example, concerns about the quality of the domestic investment that have helped sustain China’s growth since 2008, and worries about the prospects for continued economic integration in Europe, especially among the countries using the euro.
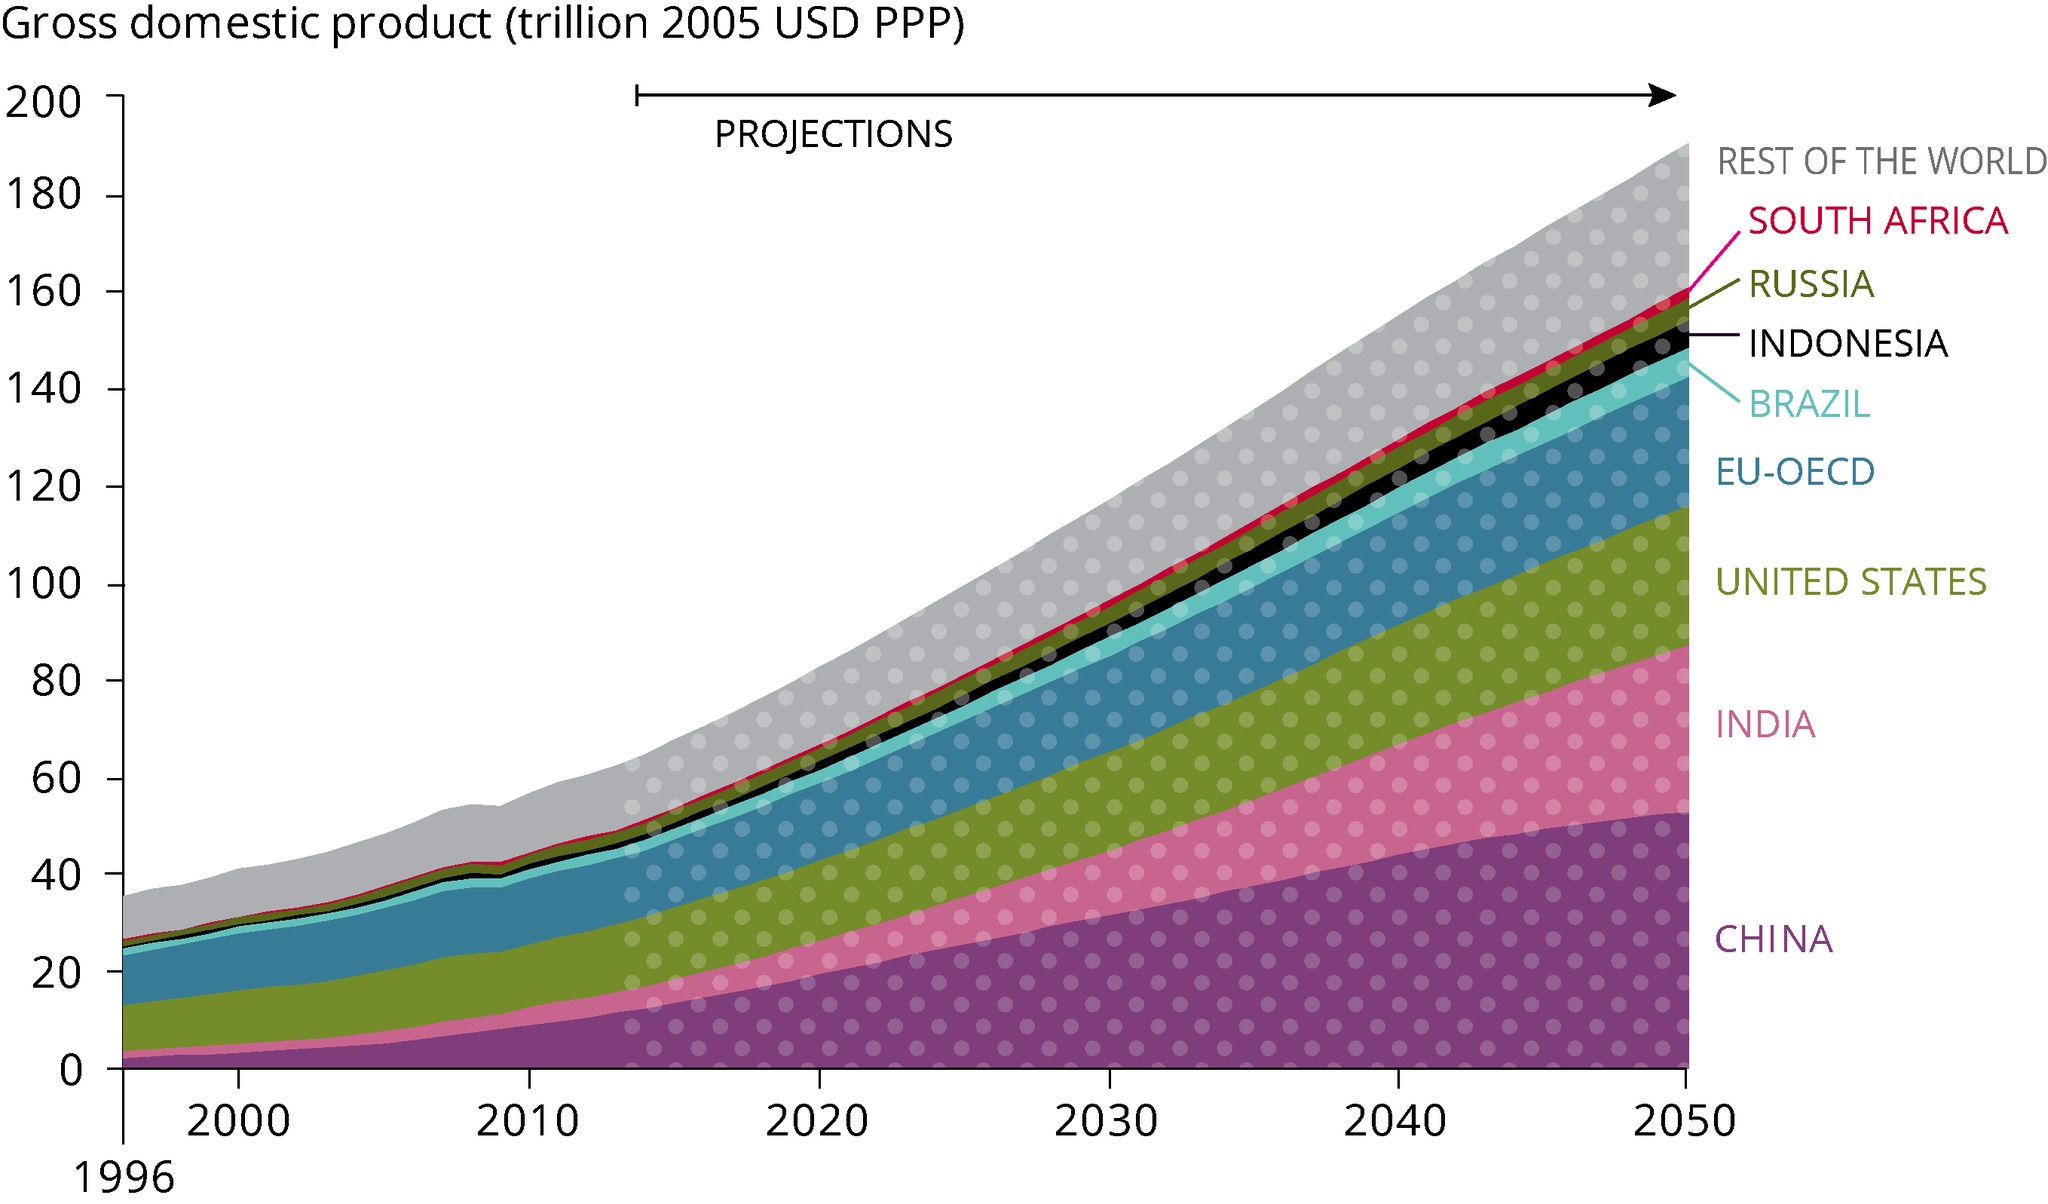
Although annual growth rates may remain volatile, however, the broad direction of global growth appears clearer in the medium and long term. World economic growth is projected to remain robust in coming decades as investment in human, social and manufactured capital enable other countries to follow in China’s footsteps. The Organisation for Economic Co-operation and Development (OECD) projects that global GDP will almost triple in the years 2010–2050 (Figure 1).
In 2013, GDP per capita (PPP) in China stood at 22 % of the US level, while India’s stood at 10 %. As those countries’ huge populations continue to shift towards the systems of production and consumption present in today’s advanced economies, the expansion in GDP is likely to dwarf even that achieved by the US during the past century. By 2050, India’s economic output is projected to be just 14 % smaller than US economic output while China’s is projected to be 40 % larger.
Global economic growth is expected to decelerate steadily in the coming decades, however, from a post‑crisis peak of 4.3 % in 2017 to just under 2 % a year in 2050. Economic expansion in China is projected to slow particularly sharply, from an average of 7.9 % a year in 2010–2020 to 1.9 % in 2040–2050. Meanwhile, India is expected to become the fastest growing economy among Brazil, Russian, India, Indonesia, China and South Africa (BRIICS), with an average annual increase of 5.9 % in 2010–2050, although there too it is projected to slow to below 4 % by the end of the period. In the EU, demographic trends are projected to contribute to a fall in GDP growth, from 1.7 % a year in 2020 to 1.3 % in 2050 [8]
Implications
Poverty alleviation in developing regions
The combination of rapid economic growth in developing regions and much slower growth in advanced economies creates a mixture of opportunities and concerns.
While the link between GDP and human well-being is undoubtedly complex, it is clear that economic expansion delivers a range of important benefits for society. Growth plays an important role in determining household earnings and sustaining employment levels. Equally, economic performance shapes the revenues available to governments and, correspondingly, the resources available for public infrastructure and services such as education, healthcare and various forms of social security.
There is much evidence that economic growth in recent decades has delivered substantial improvements in living standards. The poverty gap – the proportion of the population living on less than USD 1.25 a day – fell globally, although the pace varied between regions. The fastest reduction was in the developing countries of east Asia and the Pacific, where the proportion fell from 35 % in 1981 to just 2.8 % in 2010. This performance contrasted sharply with the developing countries of sub‑Saharan Africa, where the proportion increased from 22 % in 1981 to 26 % in 1996, before falling back to 21 % in 2010 [7]. Nevertheless, the percentage of the global community living on less than USD 1.25 a day fell from 47 % in 1990 to 22 % in 2010 – a reduction of about 700 million people [9]
Managing inequality and environmental degradation
Economic growth in both developing and developed regions is also associated with social and economic harm that threatens to undermine improvements in living standards. One key concern relates to the distribution of wealth and incomes. Although the rapid growth of developing regions is reducing inequality of living standards at the global scale, the trends within countries often show the opposite. For example, the shift away from planned economies in countries such as Russia and China has brought greater inequality, as has the explosion of executive salaries in the US and other advanced economies [10][11]
Increased inequality has long been recognised as a potential side-effect of industrialisation, with wage disparities widening as a portion of the population moves from agricultural activities to more productive urban work [12]. Later stages in structural economic change tend to see a convergence of rural and urban wages. Recent analysis suggests, however, that the sluggish growth in many advanced economies could augment inequality by leading to the accumulation and concentration of wealth [13]. Technological advances may further augment inequality (GMT 4). Mitigating the inequities that can arise from economic growth trends is, therefore, a governance challenge at all stages of economic development.
Another concern relates to the links between the economic growth and environmental degradation. Although in many areas resource efficiency is increasing, the scale of economic activity globally is pushing resource use and emissions to higher absolute levels (GMTs 7, 8, 9, 10), with potentially huge impacts on natural cycles. The interdependence of global environmental systems means that individual countries and regions, including Europe, are increasingly affected by action elsewhere.
While slower growth in the EU and elsewhere may alleviate environmental pressures, it also brings social and environmental risks [14]. In some EU countries, an expected rise in dependents relative to the working population is likely to undermine labour tax revenues while boosting the demand for pensions and public health expenditure [15]. And while the accumulating wealth that may accompany slow growth could provide an alternative tax base, governments face some difficulties in raising revenues from this source as liberalised financial markets enable investment and profits to shift to countries offering lower taxes.[13] Taken together, these fiscal pressures could weaken investment in environmental protection and motivate governments to relax environmental standards in order to boost economic growth.
Moving beyond GDP
Worries about the social and environmental harm that can arise when governments focus too narrowly on economic growth have directed attention to the need for better measures of human well-being and economic robustness. Quality of life, it is argued, is shaped by numerous factors that are at most partially related to economic output. These include health, time with friends and family, access to resources and a pleasant living environment, education, social equity, leisure, political participation, and personal and economic security.
Equally important, GDP provides little indication of the status of the capital stocks that underpin output; indeed, focusing just on GDP growth actually creates incentives to deplete capital stocks because the returns are treated as income.
A number of processes have been initiated in recent years to develop better indicators of progress by integrating environmental and social components. These include the EU’s Beyond GDP initiative [16][17], the Commission on the Measurement of Economic Performance and Social Progress initiated by the French government in 2008 [18], the United Nations Human Development Index [19], and the OECD Better Life Index [20]. Stiglitz et al. capture the current mood with the observation that ‘the time is ripe for our measurement system to shift emphasis from measuring economic production to measuring people’s well‑being’ [21]
References:
[1]  Maddison, A. (2013) 'Maddison historical GDP data', accessed July 18, 2013.
[2]  World Bank (2006) Where is the wealth of nations - Measuring capital for the 21st century, The World Bank, Washington DC.
[3]  Rodrik, D., Subramanian, A. and Trebbi, F. (2004) 'Institutions rule: the primacy of institutions over geography and integration in economic development', Journal of economic growth 9(2), 131–165.
[4]  Daly, H. E. (1992) 'From empty-world economics to full-world economics: Recognizing an historical turning point in economic development', in: Goodland, R., Daly, H. E., and El Serafy, S. (eds), Population, technology and lifestyle: The transition to sustainability, Island Press, Washington DC, pp. 23–37.
[5]  Piketty, T. and Zucman, G. (2014) 'Capital is back: wealth-income ratios in rich countries 1700–2010', Quarterly Journal of Economics 129(3).
[6]  UN (2013) World population prospects: the 2012 revision, United Nations Department of Economic and Social Affairs, New York, US.
[7]  World Bank (2014) 'Data | The World Bank', accessed July 18, 2014.
[8]  OECD (2014), 'OECD.StatExtracts, Economic Outlook No 95 – May 2014 – Long-term Baseline Projections', accessed 6 November 2014.
[9]  UN (2013) The Millennium Development Goals report 2013, United Nations.
[10]  UNDP (2013) 'Human development report 2013 — The rise of the South: human progress in a diverse world', United Nations Development Programme.
[11]  Stiglitz, J. E. (2013) 'The price of inequality: how today’s divided society endangers our future', 1 edition., W. W. Norton & Company.
[12]  Kim, S. (2008) 'Spatial inequality and economic development: theories, facts, and policies', in: Spence, M., Annez, P. C., and Buckley, R. M. (eds), Urbanization and growth, Commission on Growth and Development.
[13]  Piketty, T. (2014) Capital in the twenty-first century, Harvard University Press.
[14]  Everett, T., Ishwaran, M., Ansaloni, G. P. and Rubin, A. (2010) Economic growth and the environment, Defra Evidence and Analysis Series, Paper 2, Defra, London, UK.
[15]  EC (2012) 'The 2012 ageing report — Economic and budgetary projections for the 27 EU Member States (2010–2060)', European Economy, 2/2012, European Commission, Brussels.
[16]  EC (2009) 'Communication from the Commission to the Council and the European Parliament - GDP and beyond : measuring progress in a changing world', COM/2009/0433 final
[17]  EC (2013) 'Progress on ‘GDP and beyond’ actions', SWD(2013) 303 final,
[18]  CMEPSP (2013) 'Commission on the Measurement of Economic Performance and Social Progress - Home page', accessed July 17, 2013.
[19]  UNDP (2014) 'Human Development Index (HDI)', accessed May 12, 2014.
[20]  OECD (2013) 'OECD – Your Better Life Index', accessed July 17, 2013.
[21]  Stiglitz, J. E., Sen, A. and Fitoussi, J.-P. (2009) Report by the Commission on the Measurement of Economic Performance and Social Progress, Commission on the Measurement of Economic Performance and Social Progress.
 Aragonese
 English
 Spanish