This post is also available in: Spanish
My last post in Prevención Integral -the site by the Specific Research Centre for the Improvement and Innovation at Companies (CERpIE) of the Technical University of Catalunya- is entitled “Gestión de la #PRL: conectar los objetivos con las alternativas” [1] (#PRL management: connecting objectives to alternatives”) and is all about causal diagrams, one of the tools for strategic management of organisations [2].
A causal diagram -also known as causal map– consist of a graph obtained from the objectives analysis of each actor involved in a decision-making or planning process.
So, an objectives tree [3] is a good starting point to build a causal diagram. Starting from the measurement criteria obtained in the objectives tree, you can analyze the factors influencing (or affected) by such criteria. Is is also possible that the criteria obtained from an objectives trees influence one another.
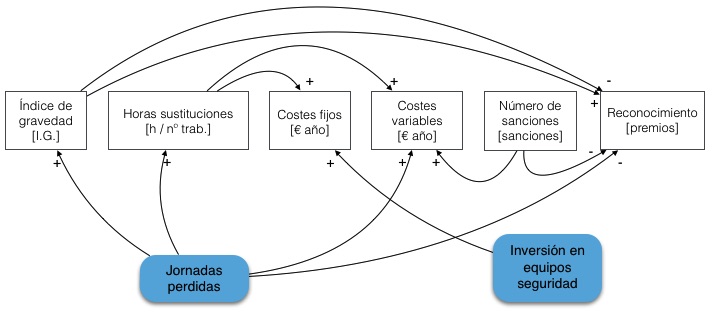
The influence relations between the criteria and the corresponding factors are depicted by means of arrows. The end point of each arrow is labeled with a (+) or (-) symbol, to denote a positive or negative correlation between the factors and the criteria.
In addition to the objectives tree, a means-end diagram [4] may provide a good support when analyzing the factors to add to a causal diagram, as the means-end diagram brings certain alternatives affecting the objectives of each actor, which is, in fact, what we are looking for.
At the end, a causal diagram may look like the one used as an example in the series of articles I drafted in the PI&ORP site [1]:
The causal diagram is the fourth stage within the analysis of a decision making process:
- problems demarcation and problems statements;
- objectives tree;
- means-end diagram;
- causal map, or causal diagram.
The next stage is known as “system diagram” and will be analysed in a further article.
In this blog, you may find information about all these management tools. But if you want to go in depth on the topic, I refer you to the space I run in the UPC´s Prevención Integral site, which is also called “Aragon Valley” (in Spanish).
References:
[1] MAIRAL, DAVID. 31 Mar 2015. Gestión de la #PRL: conectar los objetivos con las alternativas. http://www.prevencionintegral.com/comunidad/blog/aragon-valley/2015/03/30/gestion-prl-conectar-objetivos-con-alternativas. Prevención Integral. Consulted 1 Apr 2015.
[2] ARAGON VALLEY. 31 Jan 2015. Tools for the strategic management of safety and health in the organizations. http://www.aragonvalley.com/en/tools-strategic-management-safety-health-organizations/. Consulted 1 Apr 2015.
[3] ARAGON VALLEY. 26 Feb 2015. Goal tree as a method to establish a good set of criteria. http://www.aragonvalley.com/en/goal-tree-method-establish-set-criteria/. Consulted 1 Apr 2015.
[4] ARAGON VALLEY. 17 Mar 2015. The means-end diagram: a method to identify the means to reach objectives. http://www.aragonvalley.com/en/the-means-end-diagram-a-method-to-identify-the-means-to-reach-objectives/. Consulted 1 Apr 2015.
 Aragonese
 English
 Spanish